2022 CDHD District Density Index
For a new version of the District Density Index, view the District Density Scale. This tool categorizes all congressional districts into four categories ranging from Predominantly Urban to Predominantly Rural according to household density and was updated for the 119th Congress (2025-2026).
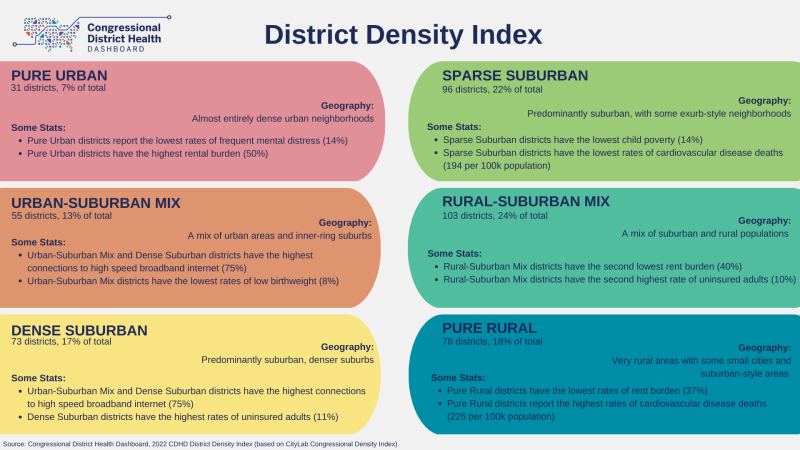
Congressional districts vary in many ways, including the extent to which they are urban, suburban or rural. To help capture that variability, our team at the Department of Population Health at NYU Grossman School of Medicine calculated the 2022 CDHD District Density Index for the newly drawn 2022 (118th Congress) congressional districts. Building on methods developed by CityLab in 2018, we categorized all congressional districts on the following gradient of household density:
Pure Rural (lowest household density)
Rural-Suburban Mix
Sparse Suburban
Dense Suburban
Urban-Suburban Mix
Pure Urban (highest household density)
Why is this useful?
The CDHD District Density Index captures substantial differences in household density across U.S. congressional districts. Though we often think of health and place as a rural/urban divide, the majority of people in the U.S. live in suburban areas—loosely defined as towns and cities around major cities. In recent years, suburban population growth has been attributed almost exclusively to an increase in minority populations moving to suburbs. Valuable information would be lost by oversimplifying congressional districts into two categories – “urban” and “rural”. The District Density Index can help reveal trends and indicators of health and equity in congressional districts across the full spectrum of household density.
We analyzed a number of metrics from the Congressional District Health Dashboard using the District Density Index. Some highlights are in the graphic below. The 2022 CDHD District Density Index can be further applied to many types of analysis and datasets. We welcome use of it in your work, or please reach out with questions or to collaborate. For details on CityLab’s earlier methodology, go here. Our 2022 CDHD methodology is detailed here, which includes a suggested citation.