June 2023 Site Update – Findings Factsheet
June 30, 2023
A Snapshot of Health Trends Across Congressional Districts: Broadband, Poverty, Uninsurance, RentBurden, and More
The Congressional District Health Dashboard has expanded to include census tract-level data for 24 metrics, and new years of data for 22 metrics, giving policymakers and advocates even more data to work with for improving health. This factsheet presents trends and insights mined from these new data and shows how data can be used to uncover health challenges across congressional districts. For example:
There is wide variation in access to broadband within congressional districts.
New York’s 12th Congressional District saw the largest increase in child poverty between 2020 and 2021.
Texas’s 2nd Congressional District had the greatest increase in uninsured residents from 2020 to 2021 at 11.5%.
Rent burden worsened (or stayed the same) year over year across congressional districts.
New Census Tract-Level Data – Highs and Lows Within Each District
For 24 Dashboard metrics, users can now view census tract-level data within each district and identify neighborhood-level differences within congressional districts.
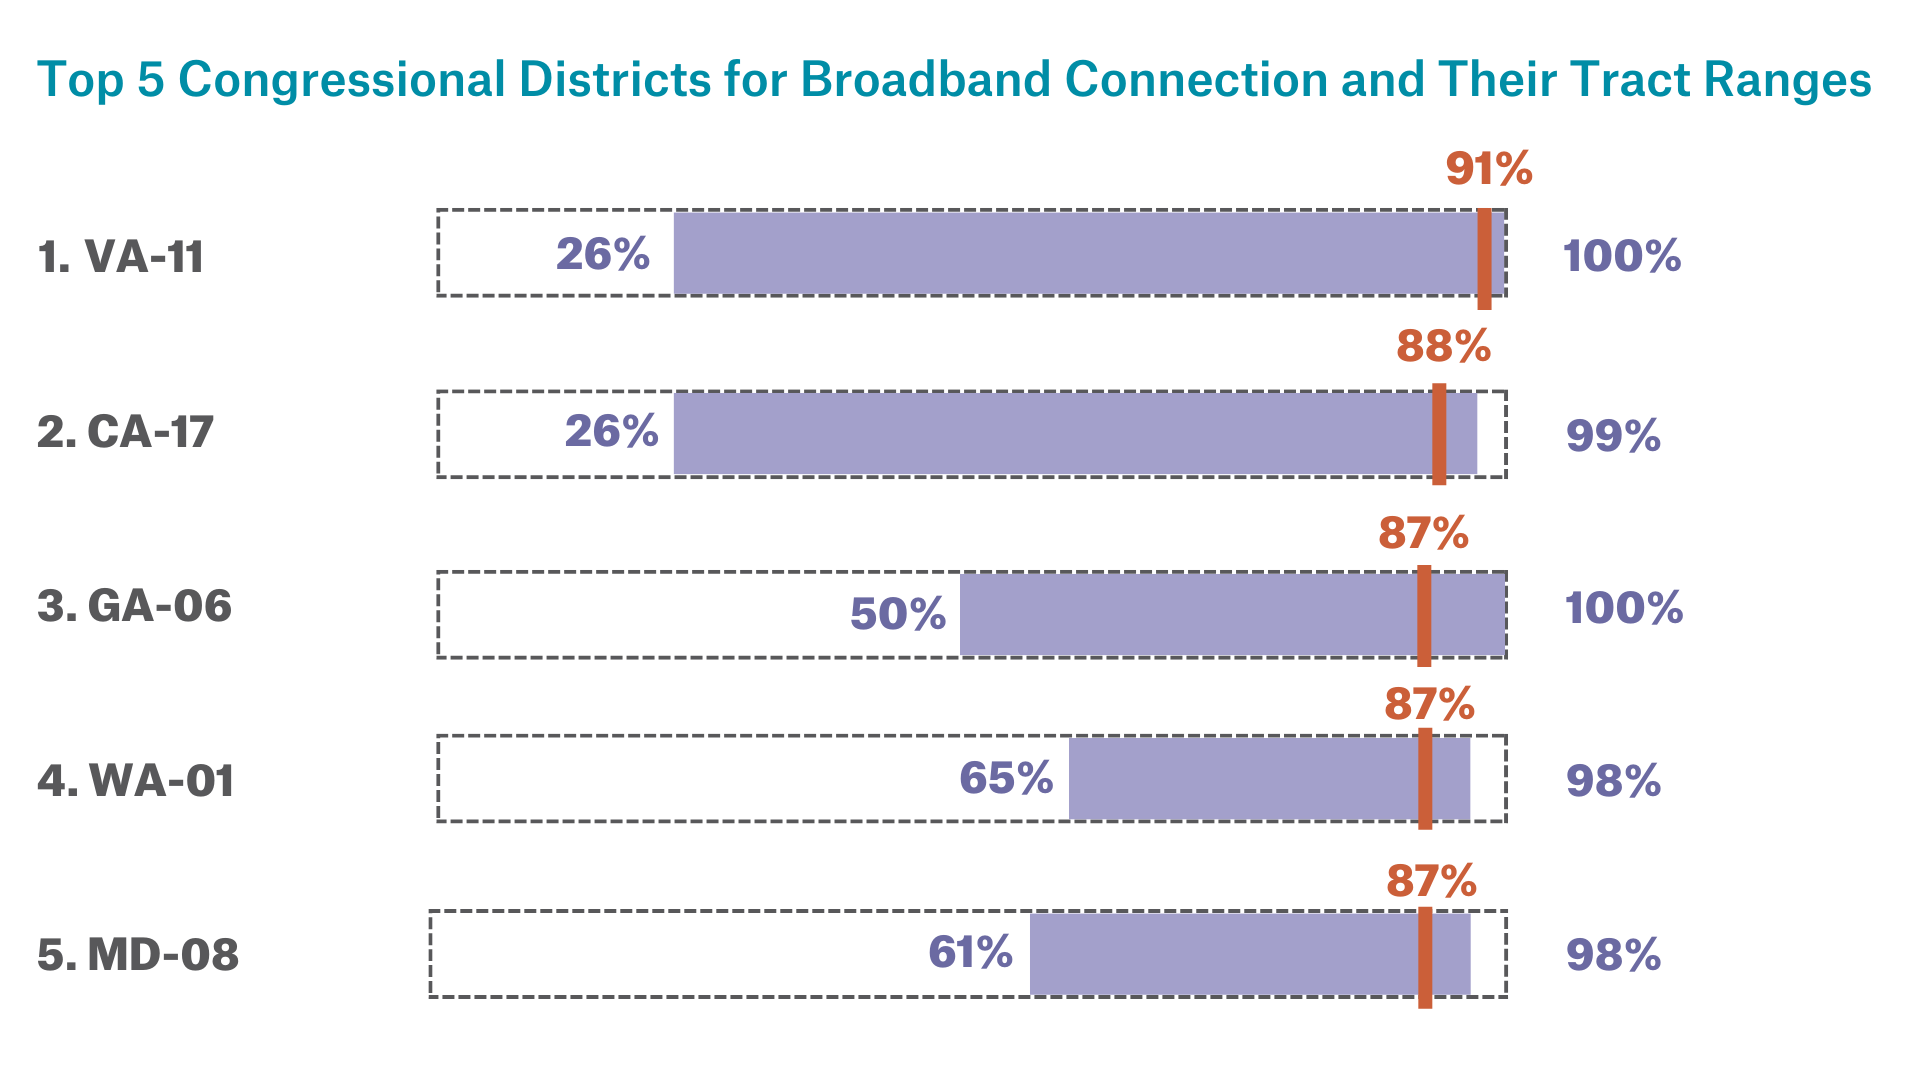
A Closer Look at Broadband
Looking at the five congressional districts with the highest percentage of connections to high-speed broadband, we see that variation within a given district shows a much more nuanced picture of broadband access. Even in the most connected districts, there are disparities at the tract level. For example, Virginia’s 11th District, a suburban district in northern Virginia, is the most connected district in the country, with 91% of residents connected to broadband, yet there is a gap of 74 percentage points between its least connected and most connected census tracts. All residents are connected in some tracts, while barely one in four residents are connected to high-speed broadband elsewhere in the district. This demonstrates the importance of geographically granular data instead of larger geographic averages for understanding local community challenges within districts.

Explore your district’s broadband connection and census tract variation.
Identify Trends with New Years of Data
The Dashboard now displays a new year of data for 22 metrics, so that users can see changes year over year. Here, we analyzed rates of children in poverty, uninsurance, and rent burden to identify significant changes between 2020 and 2021.
Children in poverty: New York’s 12th District had the largest increase in child poverty between 2020 and 2021 at 15.5% and the greatest decrease was in Arizona’s 6th District at 13.3%.
Uninsurance: Texas’s 2nd District saw the greatest increase in uninsured residents from 2020 to 2021 at 11.5%, with the greatest decrease in New York’s 17th District at 9.6%.
Rent burden: Generally, rent burden worsened (or stayed the same) year over year, with many districts in the South (Texas, Arkansas, Oklahoma, Mississippi), the Midwest (Kansas, Nebraska, Wisconsin), and the West (Oregon, Washington, Nevada, Utah) experiencing higher rent burden between 2020 and 2021.
Explore these new data as well as innovative site features on the Congressional District Health Dashboard website, or reach out to schedule a walk-through with us. We want the Dashboard to be as useful as possible to local policymakers and advocates across the country. That’s why we are committed to regularly updating the data and improving site features based on user feedback.