Introducing the Congressional District Health Dashboard
January 25, 2023
Most data on health, the drivers of health, and health equity are organized at the county, state, or, more recently, city level. In contrast, data about the health of people living in congressional districts is difficult to find. That’s where the Congressional District Health Dashboard (the Dashboard) comes in. The Dashboard provides actionable measures of health and its drivers calculated at the congressional district level, showing users how their district is doing on health outcomes, social and economic factors, and more. The Dashboard is the first resource of its kind to provide this data in districts representative of the 118th Congress, following redistricting in 2022.
The Dashboard was created by our team in the Department of Population Health at NYU Grossman School of Medicine, in partnership with and support from the Robert Wood Johnson Foundation, and builds on our experience creating and managing the City Health Dashboard since 2018. The Congressional District Health Dashboard (CDHD) launched January 25, 2023 as a first-of-its-kind resource, offering trusted data on health and its drivers for all 435 (+Washington DC) U.S. congressional districts. The Dashboard incorporates the 2022 re-drawn district boundaries based on the 2020 census, corresponding to the 118th Congressional session that started in January 2023.
Our goal with the CDHD is to provide policymakers, advocates, and community members with an array of actionable and nonpartisan data at the congressional district level– such as life expectancy, diabetes rates, uninsurance, and children in poverty – to demonstrate strengths and challenges in their regions and drive positive change at the district, state and national level.
Exploring the Dashboard
To begin, start typing or select a congressional district from the drop-down on the homepage, and once selected, you’ll land on the District Snapshot. The Snapshot consists of the Metrics Overview and District Facts. The Metrics Overview shows how the district is doing on all metrics, as compared to the national average for each. For each metric on the Overview, you can hover over the (i) tooltip for more details about the metric year and source, and click the metric name to go straight to the district map for that metric. The District Facts page provides an overview of the population of the district, including the breakdown by age and race/ethnicity, and the district’s representation in the House of Representatives as well as the U.S. Senate.
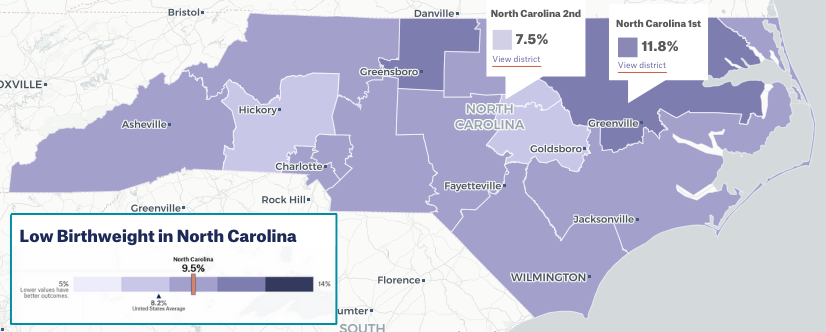
The Metric Maps page provides a map view of a selected metric for all districts across the U.S., within a single state, and by individual districts. You can compare the district’s value to the U.S. or State average.
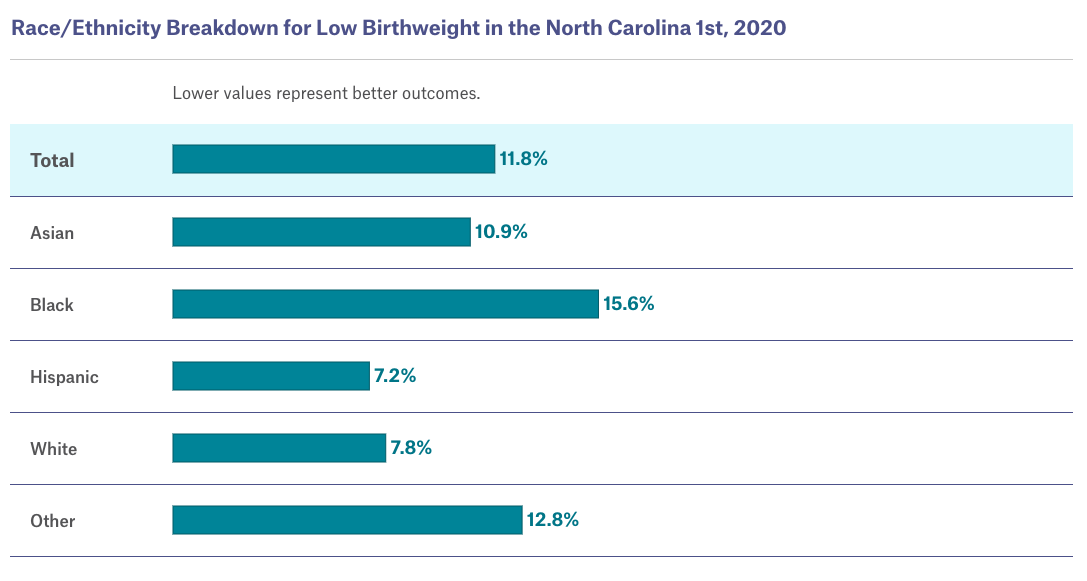
The Metrics by Demographics page shows the racial/ethnic, age or sex breakdown of a given metric for each district when available. Not all metrics have demographic breakdowns available.
All congressional district data is downloadable from the Access the Data page, along with our methodology and technical documentation. We encourage use of the data in other tools and projects with proper citation.
Data into Action
Data is an important component in policymaking. With the CDHD’s district-specific data, policymakers, advocates, journalists, and community members get a clearer picture of the most important challenges in their communities, and are better positioned to influence policy changes at the district, state, and national level. For example:
Members of Congress can better prioritize health needs after viewing district health profiles and comparing their district’s health outcomes, such as rates of cancer deaths, with those of other districts.
Senators and Representatives can advocate for funds and federal programming to be targeted to congressional districts in their state with the highest uninsured rates or the highest child poverty rates.
Advocates can show lawmakers how their district or state compares to others on cancer deaths or access to healthy foods.
Researchers can leverage data on differential outcomes by race and ethnicity to understand the impact of policies on health and health equity.
Next Steps
Explore your congressional district’s data today! To learn more about the site and its data, please check out our FAQ, technical documentation, and metric background pages. We welcome feedback, questions, and examples of how you’re using the data (just email us). And be sure to subscribe for updates – we plan to add some great data and features!