Medicaid Enrollment


...
Why do we measure Medicaid Enrollment?
Medicaid is an important source of health insurance for millions of low-income families and children, for people with disabilities and chronic health conditions, and for those in need of long-term services and support. Individuals who meet eligibility requirements are guaranteed coverage, though individuals often face barriers to maintaining their coverage due to challenges with the Medicaid renewal process. Medicaid is jointly funded by states and the federal government and administered at the state level in accordance with federal requirements.1,2 Studies have demonstrated that Medicaid improves health outcomes, particularly for those who are uninsured and/or low-income; and Medicaid has been shown to provide beneficiaries with substantially better access compared to not having insurance.2
In recent years, Medicaid enrollment trends have fluctuated substantially. From 2017 to 2019, Medicaid enrollments decreased.3 With the onset of the COVID-19 pandemic, Congress passed the Families First Coronavirus Response Act (FFCRA) which included a requirement that Medicaid programs keep people continuously enrolled through the end of the COVID-19 public health emergency (PHE). This provision prevented temporary loss of Medicaid coverage.1,2,4-6 Between February 2020 and April 2023, there was a record 32.4% net increase in Medicaid enrollment -- driven primarily by the continuous enrollment provision, and reflecting both economic conditions related to the pandemic and the adoption of Medicaid expansion in the Affordable Care Act in several states. Since the COVID-19 PHE officially ended on March 31st, 2023, many states have resumed Medicaid disenrollment, resulting in large decreases in program enrollment for FY 2023 and further declines projected for FY 2024.6,7
How do we measure Medicaid Enrollment?
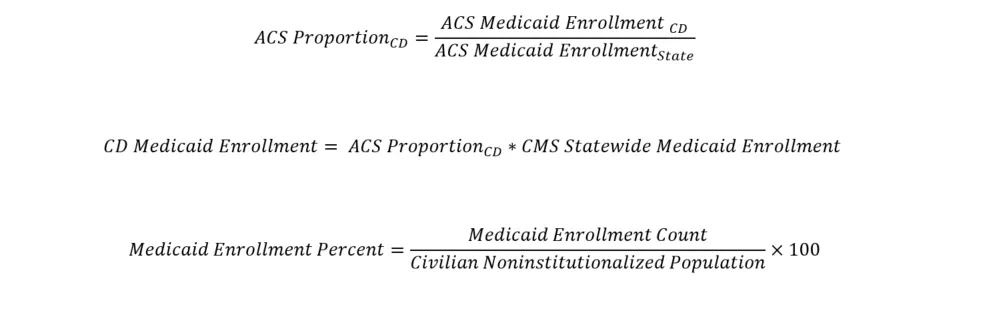
This metric represents the percent (%) of the population of the Congressional District that were enrolled in Medicaid in the past quarter. To estimate Medicaid enrollment, we use a combination of American Community Survey (ACS) data and Centers for Medicare & Medicaid Services (CMS) data. Medicaid enrollment data at the congressional district level are available directly from the ACS, but those data tend to underestimate true enrollment numbers due to the sampling design of the survey. For this reason, we use ACS data to calculate the proportion of state Medicaid enrollees in each congressional district, and then apply these proportions to the statewide enrollment numbers from CMS to get final enrollment numbers for each congressional district. To derive quarterly estimates, three-month averages of statewide enrollment numbers are used.
Strengths and Limitations
Strengths of Metric | Limitations of Metric |
This measure provides congressional district-level data that corrects for potential underestimation due to survey self-report. This metric provides a quarterly, timely report on Medicaid enrollment, allowing for observation of trends over time. | This metric does not provide insight regarding the proportion of the population that is Medicaid-eligible but not enrolled. |
Calculation
Percent (%) of population enrolled in Medicaid in the past quarter for congressional districts is calculated by the following formulas:

Data Source
Estimates for this metric are from the 2023 American Community Survey (ACS) data using table S2704 and from 2022-2024 Centers for Medicare & Medicaid Services (CMS) State Medicaid and CHIP Applications, Eligibility Determinations, and Enrollment Data using the total_medicaid_enrollment column.
Years of Collection
Calculated by the Dashboard Team using data from 2025 Q3, 1 quarter average estimate.
References
About us. Medicaid (n.d. ) https://www.medicaid.gov/about-us/index.html
10 things to know about Medicaid | KFF. (2023, June 30). KFF. https://www.kff.org/mental-health/issue-brief/10-things-to-know-about-medicaid/
Analysis of recent declines in Medicaid and CHIP enrollment | KFF. (2019, November 25). KFF. https://www.kff.org/medicaid/fact-sheet/analysis-of-recent-declines-in-medicaid-and-chip-enrollment/
Medicaid Enrollment & Spending Growth: FY 2020 & 2021 | KFF. (2020, October 14). KFF. https://www.kff.org/medicaid/issue-brief/medicaid-enrollment-spending-growth-fy-2020-2021/
Medicaid Enrollment and Spending Growth Amid the Unwinding of the Continuous Enrollment Provision: FY 2023 & 2024 | KFF. (2023, November 13). KFF. https://www.kff.org/medicaid/issue-brief/medicaid-enrollment-and-spending-growth-amid-the-unwinding-of-the-continuous-enrollment-provision-fy-2023-2024/#:~:text=Medicaid%20enrollment%20growth%20slowed%20to,by%208.6%25%20in%20FY%202024
Medicaid Enrollment & Spending Growth: FY 2022 & 2023 | KFF. (2022, October 25). KFF. https://www.kff.org/medicaid/issue-brief/medicaid-enrollment-spending-growth-fy-2022-2023/
10 Things to Know About the Unwinding of the Medicaid Continuous Enrollment Provision| KFF. (2023, June 9). KFF. https://www.kff.org/medicaid/issue-brief/10-things-to-know-about-the-unwinding-of-the-medicaid-continuous-enrollment-provision/#two
Last updated: April 28, 2026