June 2023 Data Release
By Samantha Breslin, Caleigh Paster
It has been an exciting and busy 6 months at the Congressional District Health Dashboard since launching the site in January! We’ve been introducing the Dashboard to audiences around the country – having informative conversations, leading webinars, attending conferences, and hosting Hill briefings for congressional representatives and their staff.
We’ve also been working on new data, and developing key site updates based on user feedback that we hope will improve the user experience and aid your navigation around the site. Below, find a summary of today’s updates, and be sure to subscribe to our newsletter to stay up to date on the latest information each month. Also, check out our fact sheet from this release, covering data trends, insights, and more.
Introducing Tract-Level Data
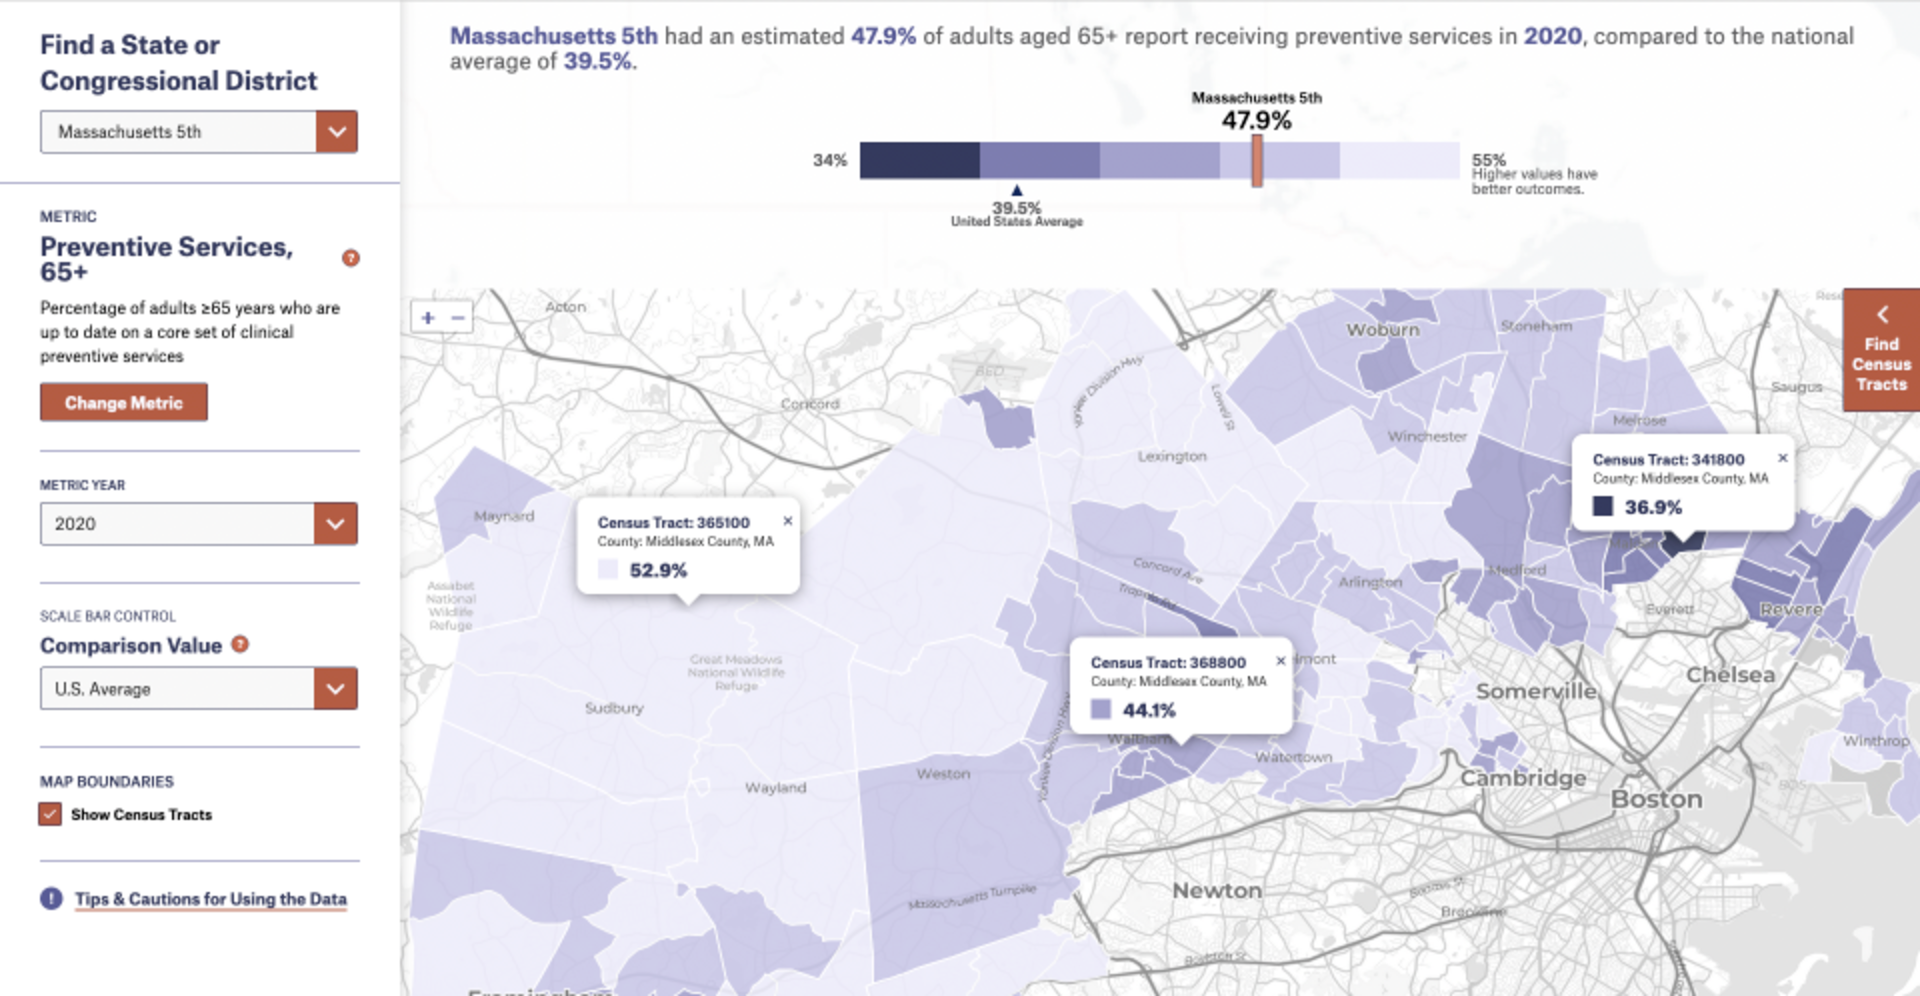
When it comes to making change to improve health, equity, and well-being, granular data is necessary to understand what is happening at the local level. We always say that seeing is believing. Starting today, users can now access census tracts for all 435 congressional districts (+DC) for any metric where census tract-level data is available. There are 24 metrics with tract data available:

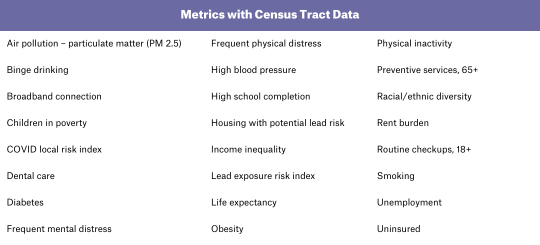
This addition is particularly exciting because it means that every census tract in the United States now has data on health and its drivers available.

Historically, it has been hard for smaller, more rural areas to access this essential information and we hope that public health practitioners, policymakers, advocates, and others are able to use these data to move the needle in the right direction for their communities.
New Years of Data
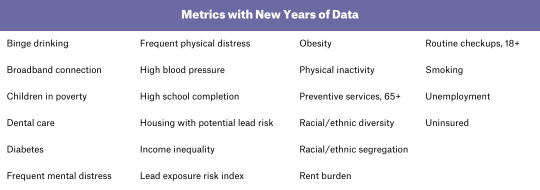
We are updating 22 measures to the most recent year of data available (2021), including all of our metrics sourced from the American Community Survey, and the CDC’s PLACES Project. This also means that for these 22 metrics, multi-year data is available, allowing you to begin to see changes over time across your district, state, and the nation, as well as across demographic groups (where available). Though you might not see big changes because these metrics include many years of data, information gathered during the pandemic appears on the Dashboard.

You can switch between years of data with the drop down menu, as you can see in the image below.


Improving the User Experience
We've been hard at work on some updates to support your data journey including streamlining site navigation, adding a tract search and highlight feature, and improving data translation and informational text, which we hope will make it easier and more intuitive to find what you need on the site – and be inspired to drive change wherever you are!
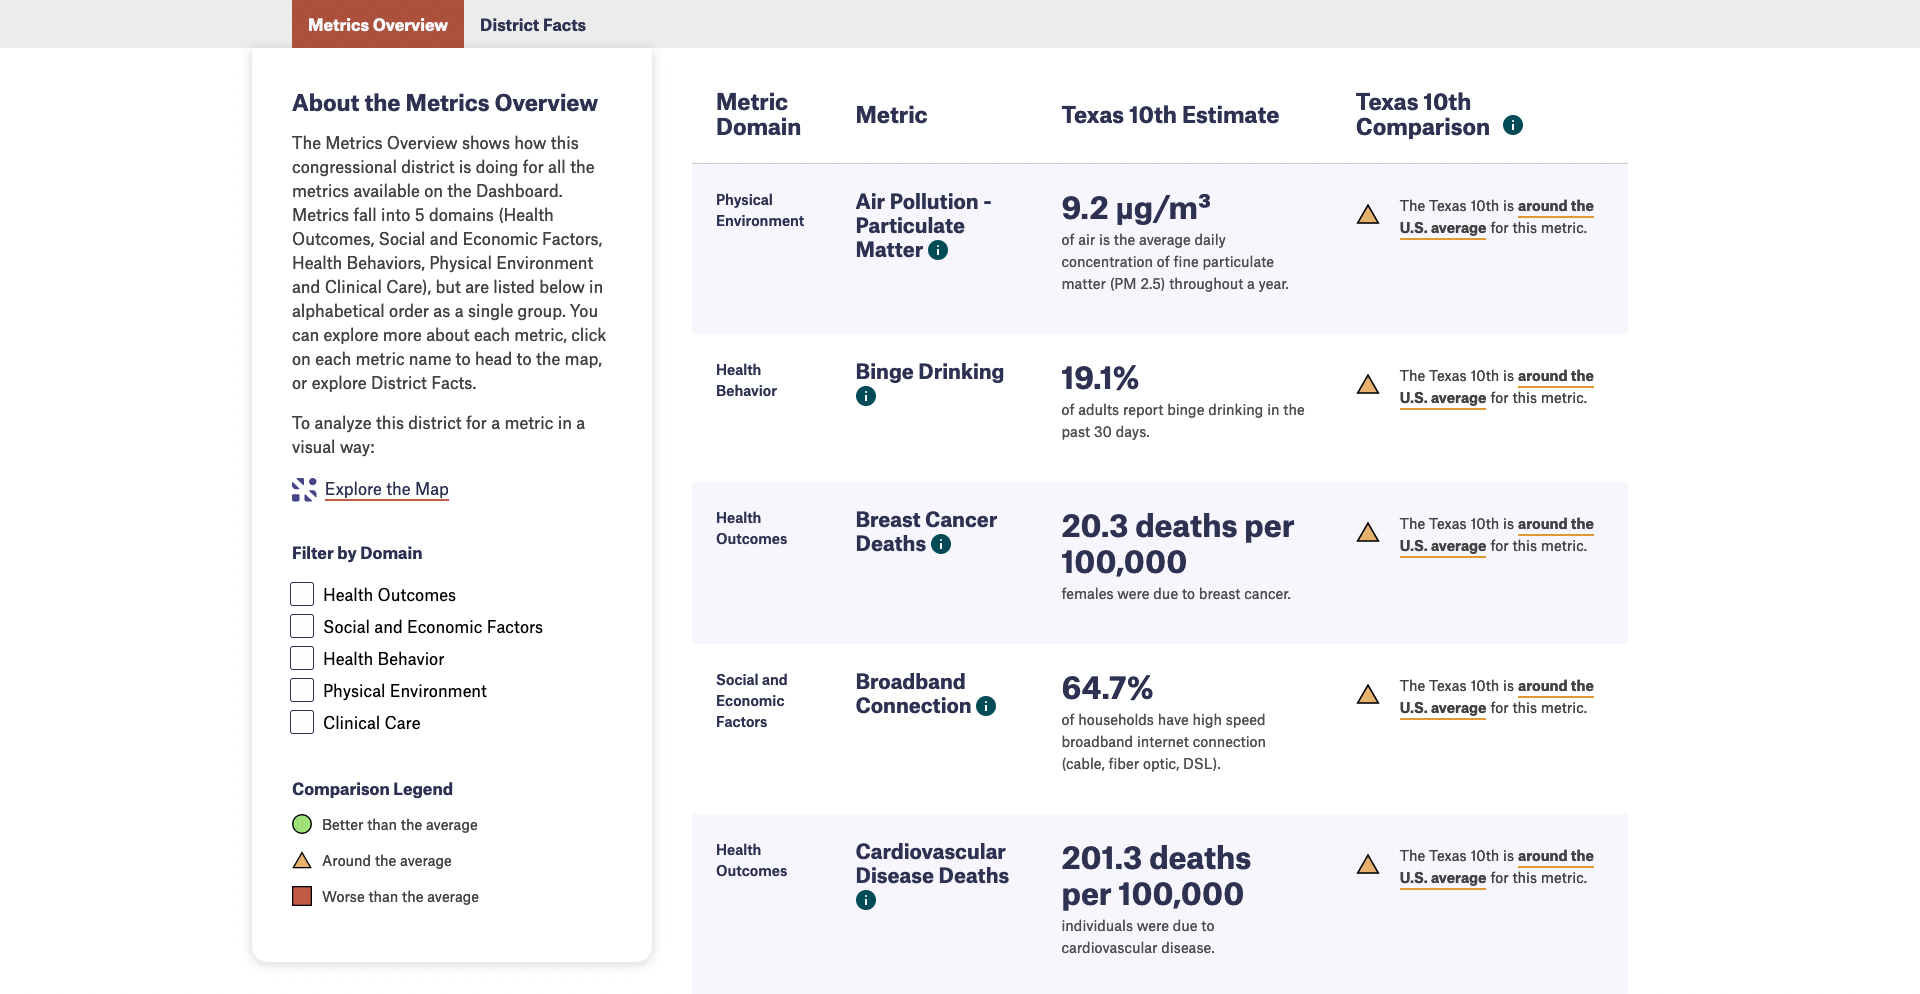
Metrics Overview
We've updated this page to show which of the five domains each metric is in, and new filtering capabilities.

Metric Maps
Adapted the district map page to account for the addition of census tracts. You’re able to turn on this feature by clicking the checkbox on the left side bar found beneath the scale bar control. The default setting will not display tracts.
Added the ability to search for a specific tract, highlight it on the map, and get more information about that tract’s performance and location through a pop-up.
Removing the Limited Supermarket Proximity Metric
The Dashboard evaluates new metrics and those already on the site continually, with high standards for statistical rigor and external validity. For the limited supermarket proximity metric, our team questioned whether the ½ mile distance to a supermarket was an appropriate cut-off for all congressional districts, urban and rural. We also discovered methodology questions around missing values. So the metric has been removed, and we aim to have a replacement measure of food access/insecurity in the near future.
(If you are also a user of the City Health Dashboard and are wondering how this change impacts that website, we plan to remove the limited supermarket proximity metric from that site later this summer).
Explore the features and new data with us at an upcoming virtual office hours on Thursday, June 22nd at 2pm ET, or reach out to schedule a walk-through with us and your team. We want the Congressional District Health Dashboard to resonate as strongly as possible with users from across the country. That’s why we are committed to growth, improvement, and evolution so that we can continue meeting the needs of everyone who visits the website. Please let us know where we can be doing better, we want to hear from you! Don’t hesitate to reach out with any feedback or ideas that you think would be helpful.

